A system or subsystem as it exists within a corporate organization may be graphically depicted
in several ways. The various graphical models show the boundaries of the system and the information used in the system.
Systems and the Context-Level Data Flow Diagram
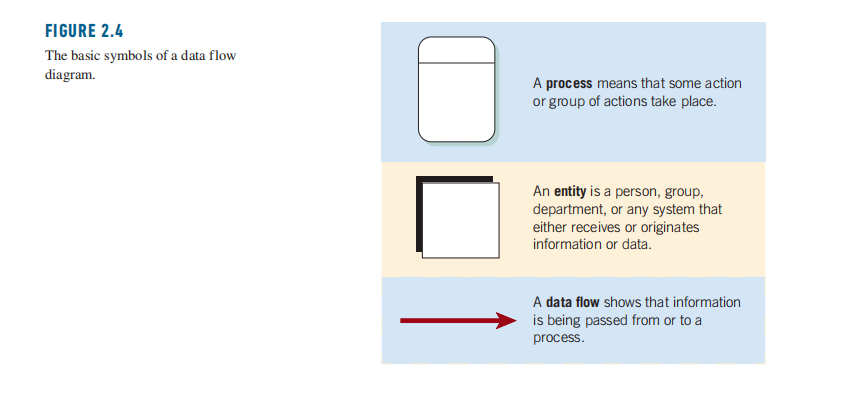
As shown in Figure 2.4, the context-level data flow diagram employs only three symbols:
(1) a rectangle with rounded corners, (2) a square with two shaded edges, and (3) an arrow. Processes transform incoming data into outgoing information, and the content level has only one process, representing the entire system. The external entity represents any entity that supplies or receives information from the system but is not a part of the system. This entity may be a person, a group of people, a corporate position or department, or other systems. The lines that connect the external entities to the process are called data flows, and they represent movement data.
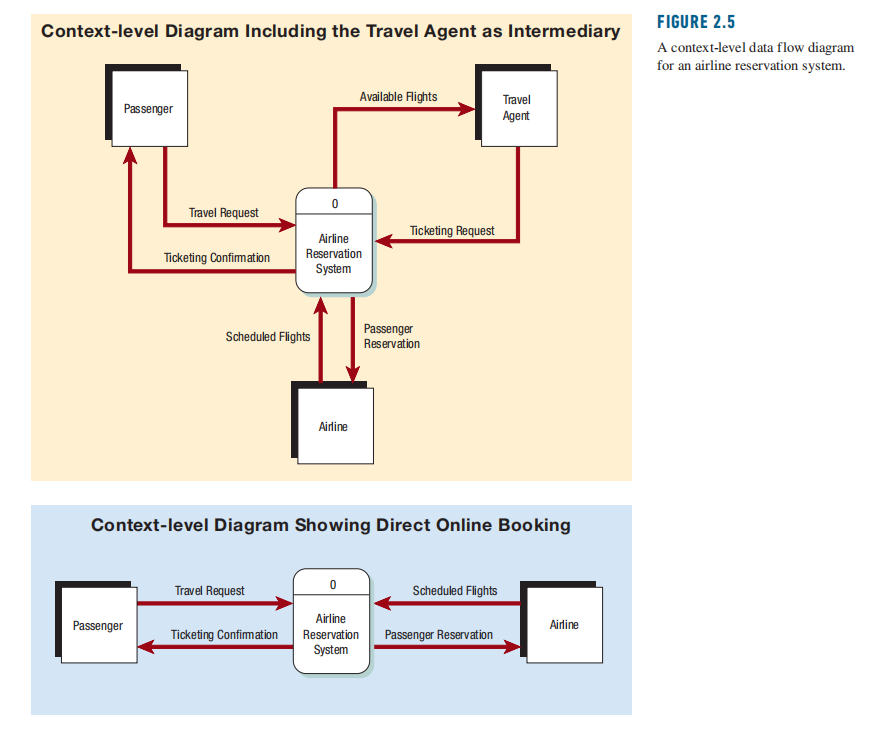
An example of a context-level data flow diagram is found in Figure 2.5. This example represents the most basic elements of an airline reservation system and shows the system before (when a travel agent acted as intermediary) and after direct online booking was made possible. In the before diagram, the passenger (an entity) initiates a travel request (data flow). The context level diagram doesn’t show enough detail to indicate exactly what happens (it isn’t supposed to), but we can see that the passenger’s preferences and the available flights are sent to the travel agent, which sends ticketing information back to the process. We can also see that the passenger reservation is sent to the airline. The second context-level diagram show what happens when the passenger books directly with an online system. The context-level data flow diagram serves as a good starting point for drawing the use case diagram (discussed later in this chapter).